Decimal Comma in Matlab Plots
A lot of languages (not only the European ones) use decimal comma instead decimal point to separate the whole and the fractional part of a number in decimal form. Matlab (like other programs) uses decimal point for this purpose. This is okay when using it for computations but it is better to use decimal comma in graphs embedded in documents written in some European language.

This approach also works in GNU Octave which is available for free. ;-)
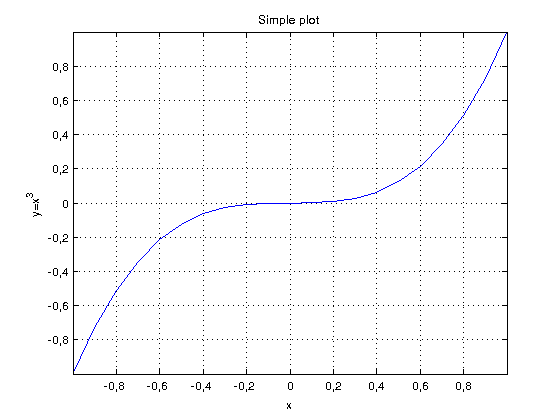
Basic plotting in Matlab is done by the plot function:
% Define function
x = -1:0.1:1;
y = x.^3;

% Open graph window and plot the function
figure;
plot(x, y);

% Label axes, show grid and title
grid on;
title('Simple plot');
ylabel('y=x^3');
xlabel('x');
To change decimal point to decimal comma I used simple approach: Function get(gca, ‘XTick’) returns the tick of X asix. In our case it is a vector -1:0.01:1. Another function set(gca, ‘XTickLabel’) sets a label for X axis. This label contains cell array of strings. The only necessary step between calling these functions is to change decimal points to commas using the strrep function.
I wrapped this code into a simple function decimal_comma with a few arguments:
- axes_handle is handle of axes to be changed. Just enter gca for current plot.
- axis_name is the name of axis to be changed: 'X', 'Y' or 'XY' for both axes.
- formatstr (optional) is simple sprintf-like format string, e.g. '%2.2f'
Just copy the code below and save it into new script file named decimal_comma.m or clone the whole Github repository:
function decimal_comma(axis_handle, axis_name, varargin)
%DECIMAL_COMMA - decimal comma in 2-D plot
%
%   A simple function to replace decimal points with decimal commas (which
%   are usual in Europe) in Matlab or Octave plots.
%
%   DECIMAL_COMMA(axis_handle, axis_name) changes decimal point to decimal
%   comma in a plot. Use gca for current axes handle and one of 'X', 'Y' or
%   'XY' for axis_name.
%
%   DECIMAL_COMMA(axis_handle, axis_name, formatstr) changes decimal point
%   to decimal comma in a plot. Number format is specified by formatstr
%   (see SPRINTF for details).

% (c) 2012 Adam Heinrich <adam@adamh.cz>. Published under the MIT license.

    if (nargin < 2 || nargin > 3)
        error('Wrong number of input parameters.');
    end

    switch axis_name
        case 'XY'
            decimal_comma(axis_handle, 'X', varargin{:});
            decimal_comma(axis_handle, 'Y', varargin{:});

        case {'X', 'Y'}
            tick = get(axis_handle, strcat(axis_name, 'Tick'));

            n = length(tick);
            labels = cell(1,n);

            for i = 1:n
                label = num2str(tick(i), varargin{:});
                labels{i} = strrep(label, '.', ',');
            end

            labels{1} = '';
            labels{n} = '';

            set(axis_handle, strcat(axis_name, 'TickLabel'), labels);

        otherwise
            error('Wrong axis name! Use one of X, Y or XY.');
    end
end
Usage for our example function y=x3:
x = -1:0.1:1;
y = x.^3;

figure;
plot(x, y);

grid on;
title('Simple plot');
ylabel('y=x^3');
xlabel('x');

decimal_comma(gca, 'XY');
If you like to hide numbers on the left and right, just add this line before set(axis_handle, …):
labels{1} = '';
labels{n} = '';
The plot will then change to:
Get the whole code from my Github!
Comments
The comments have been archived from Disqus.
Again, nice work, but I would modify 14nth line of the code from:
label = sprintf(strcat(formatstr, '|'), tick);
to:
label='';
for i=1:length(tick)
label=[label num2str(tick(i)) '|'];
end
With the above loop we avoid additional zeros (for example I had on my plot 0,10000).
Thank you for the comment, the function works much better now. I'm sorry for not mentioning it in the article earlier.
This hint from Janek is very useful!
Maybe you can add this to your explanations - I didn't read the comments at first.
By the way: With Janek's solution, you don't need line 15 anymore. My alternative version would be:
function [ ] = plotUseDecimalComma( axis_handle, axis_name)% PLOTUSEDECIMALCOMMA changes decimal point to decimal comma in a plot.
% Parameters are:
% axis_handle: Axes handle to work with (use gca for current axes handle)
% axis_name: Name of axis to be changed ('X', 'Y' or 'XY' for both axes)
if(nargin~=2)
error('Wrong number of input parameters.');
end;
switch axis_name
case 'XY'
plotUseDecimalComma(axis_handle, 'X');
plotUseDecimalComma(axis_handle, 'Y');
case {'X', 'Y'}
tick = get(axis_handle, strcat(axis_name, 'Tick'));
label='';
for i=1:length(tick)
label=[label num2str(tick(i)) '|']; %#ok
end
label = strrep(label, '.', ',');
set(axis_handle, strcat(axis_name, 'TickLabel'), label);
otherwise
error('Wrong axis name! Use one of X, Y or XY.');
end;
end
You saved my day!
Thank you very much!
I had to translate an english technical report to spanish, I had assumed to leave the points in the figures but finding your function it has been a present from heaven
thanks
Good work!
Thank you, it is very good code, but it doesn't work on Matlab 2014b. Graphic engine was changed. Everything works fine when you run it on Matlab 2014a or lower version.
Hi Lukasz, thank you for finding the bug and sorry for my late response.
I've just changed ( https://github.com/adamhein... ) the code to use the newer engine. It seems to work in older versions as well (tested on R2012).
Thank you so very much! A most helpful function that works just awesome!